데이터 분석
3. Matplotlib
Uno_says
2024. 7. 6. 13:33
728x90
1. Matplotlib
- 파이썬 기반 시각화 라이브러리
- 한글에 대한 지원이 완벽하지 않음
- pandas와 연동이 용이함
- https://matplotlib.org/
Matplotlib — Visualization with Python
seaborn seaborn is a high level interface for drawing statistical graphics with Matplotlib. It aims to make visualization a central part of exploring and understanding complex datasets. statistical data visualization Cartopy Cartopy is a Python package des
matplotlib.org
# MATLAB과 비슷하게 명령어 스타일로 동작하는 함수들의 모음
import matplotlib.pyplot as plt
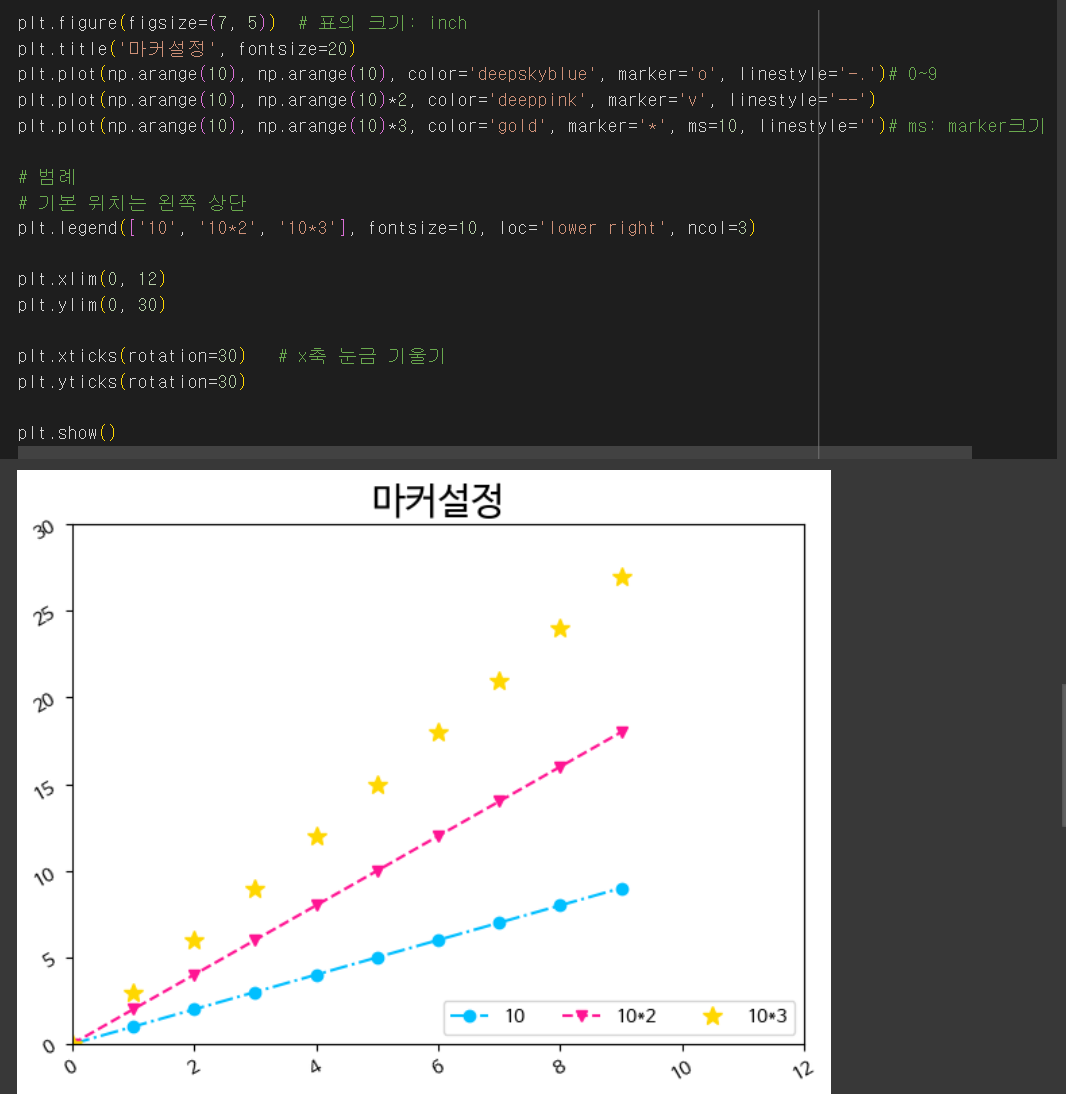
2. 스타일 옵션
# 한글 fonts-nanum 설치
!sudo apt-get install -y fonts-nanum
!sudo fc-cache -fv
!rm ~/.cache/matplotlib -rf
# 설치한 뒤 반드시 세션 모두 다시 실행하기

plt.rc('font', family='NanumBarunGothic')   # font를 NanumBarunGothic으로 설정
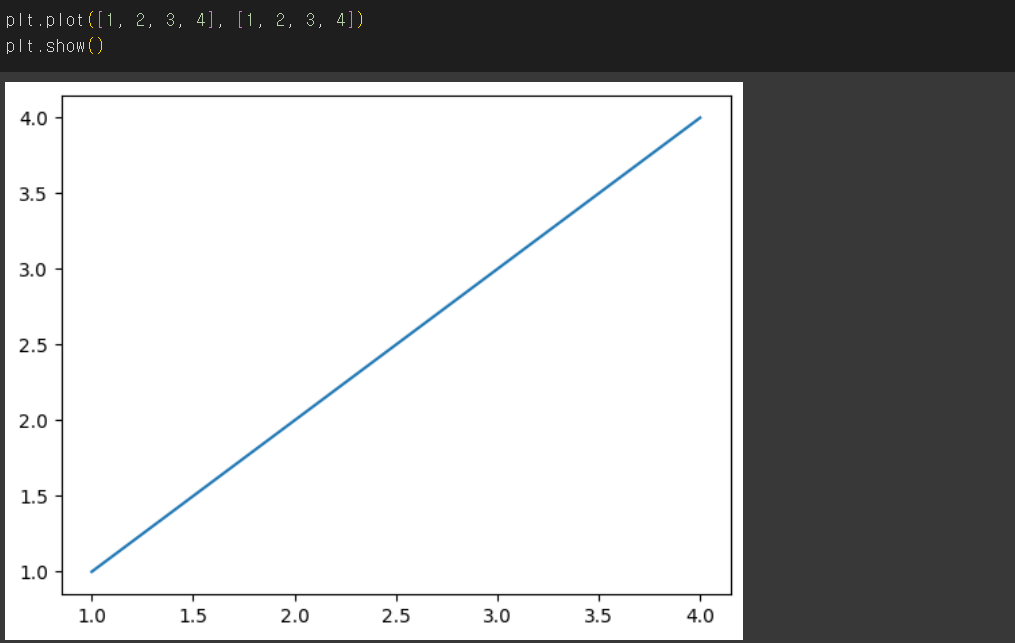
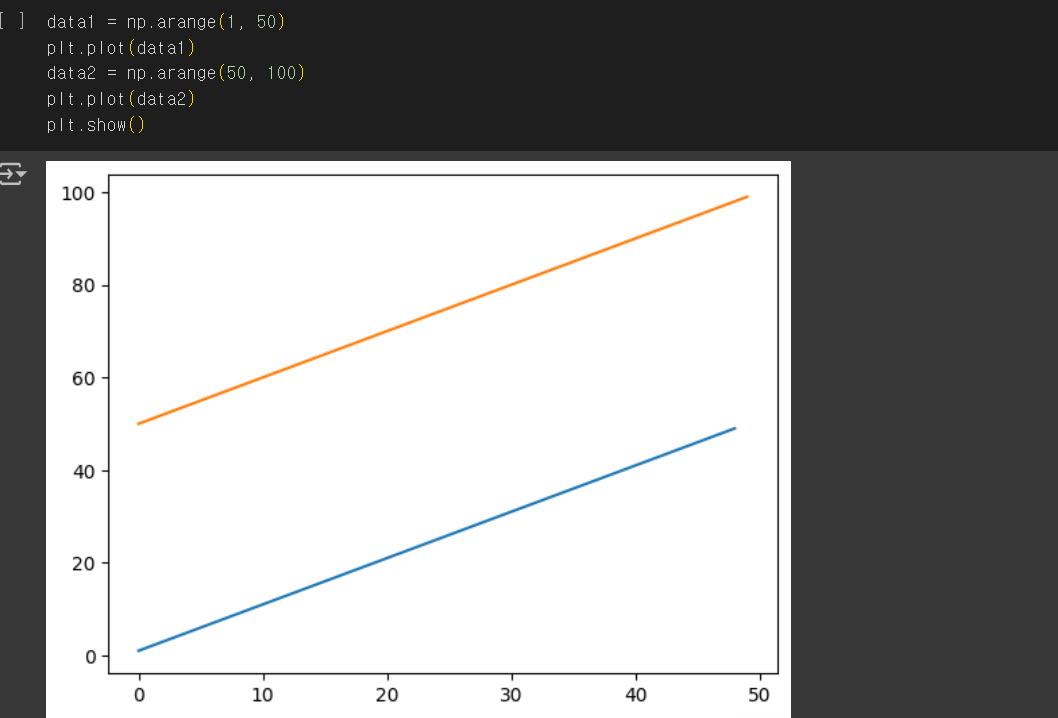
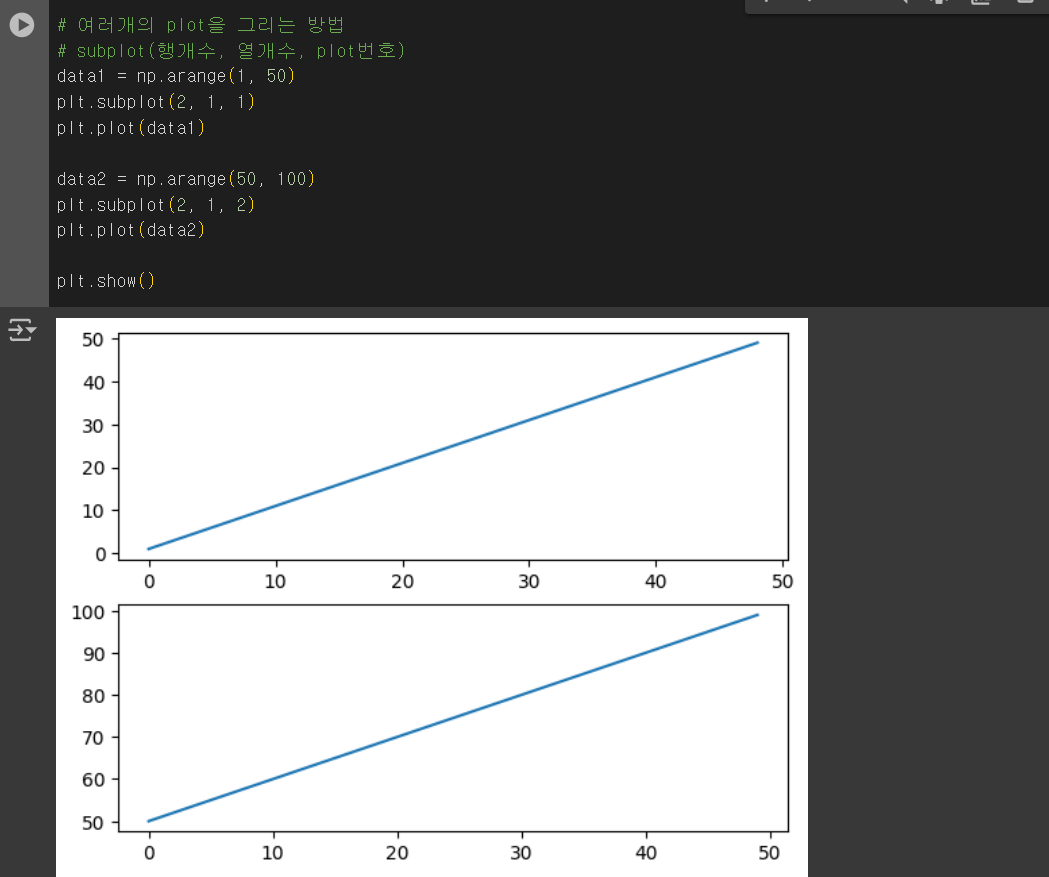
plt.plot()
plt.bar()

plt.barh()

728x90